
A research-group website usually introduces people, publications and projects. I wanted to add another way to meet the work: open a simulation, move around it, and explore how it changes.
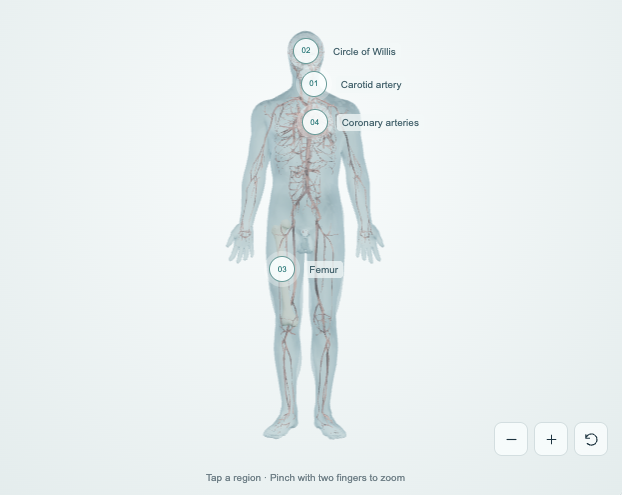
I created an AR-enabled extension of our group’s website for the simulations presented at the European Researchers’ Night. It brings four biomechanical examples into the browser: the carotid artery, the circle of Willis, the femur and the coronary arteries. You can explore them in 3D on a computer, while compatible mobile devices can also place a model in the space around you.
It started with SIMBA
The starting point was SIMBA, our framework for animated scientific simulations. We already had a workflow for moving time-dependent geometry and simulation data into an interactive environment. That made the simulations much easier to integrate into a new scene: the application could focus on navigation, presentation and interaction around existing datasets.
The website uses a browser-native viewer built with Three.js. It is not an embedded Unity build. Python tools prepare the data before publication, while JavaScript handles loading, rendering and interaction on the visitor’s device. The source datasets include SIMBA binaries and the HDF5 data used for the carotid animation.
flowchart LR
    A[SIMBA simulation data / HDF5] --> B[Python data preparation]
    B --> C[Geometry, fields and animation frames]
    C --> D[Three.js web scene]
    D --> E[Interactive 3D in the browser]
    D --> F[Animated AR through WebXR]
    D --> G[Static AR frame through iPhone Quick Look]
Load the experience
The preview below opens the actual application. Nothing from the 3D experience loads until you press the button. Once opened, it preloads the four compressed simulation sequences, approximately 96 MB in total, and shows its progress. You can also choose to enter before every sequence has finished downloading.
Interactive / M2M research simulations
Explore the simulations.
Choose a pathway, move around the model and use the playback controls. AR availability depends on the device and browser.
The application starts only on request.
Open the experience in a separate tab ↗
Keeping the data and the explanation connected
The scene is organized around the body and the four pathways. Selecting one brings the relevant simulation into focus, with playback and display controls nearby. The goal is to let someone find the example before explaining the numerical machinery behind it.
There are differences between the datasets that the interface needs to respect. The carotid example contains material and stress fields. The stent example includes deformation and stress-related fields, while the geometric femur and coronary datasets use their materials rather than an invented scalar field.
The browser is playing previously computed results. It is not solving a new mechanical problem as you move the camera. The playback cursor describes the animation sequence, and should not be read as physical time without the corresponding dataset information.
Making a scientific animation practical on the web
Geometry, connectivity and fields have different costs. The export workflow stores repeated topology and static components once, compresses the payloads and records metadata for the viewer. Positions are quantized for transfer, while the documented field values remain Float32. Some source animations are sampled to 40 states, while the carotid sequence retains its 71 states.
On the browser side, a worker decompresses and prepares the data for the selected pathway. A limited window of decoded frames keeps memory bounded, while the graphics pipeline interpolates compatible states for smooth playback. Where topology changes, those changes remain discrete.
These choices make it possible to deliver a static website rather than run a simulation service for every visitor. They are also part of the representation: compression, frame sampling and display scales should be described alongside the model, rather than mistaken for properties of the underlying physics.
From the screen to the room
On devices exposing WebXR’s immersive AR and hit-test features, the application can find a surface and place the animated model there. The AR view uses the animation data and shaders from the web scene. The user starts that mode explicitly, and the browser handles access to the camera and tracking.
The iPhone path is different. The application prepares the currently selected state as a USDZ model for Apple Quick Look. That view is static and uses materials, without exporting the full deformable animation or its scalar fields. The animated experience remains available in the web page.
The result is another way into the group’s work: the same simulation can become something to discuss at a stand, explore from a website, or inspect together with someone from a different background. SIMBA provided the starting point, while the web environment made the interaction available through a link.